How to Send Email Alerts using Prometheus AlertManager
Get mail alerts from Prometheus about server resource usage.
This is the 2nd article, to setup Prometheus with Node exporter and Grafana refer below article.
You can find the repository on Github.
The Prometheus Alertmanager is a tool for sending alerts via emails, slack and various other mediums.
In this article we’ll configure it to send Server Status alerts via email.
Let’s get started.
First update the docker-compose.yml to include alertmanager image.
version: '3.8'
networks:
  monitoring:
    driver: bridge
volumes:
  prometheus_data: {}
  grafana_data: {}
  alertmanager-data: {}

services:
  node-exporter:
    image: prom/node-exporter:latest
    container_name: node-exporter
    restart: unless-stopped
    volumes:
      - /proc:/host/proc:ro
      - /sys:/host/sys:ro
      - /:/rootfs:ro
    command:
      - '--path.procfs=/host/proc'
      - '--path.rootfs=/rootfs'
      - '--path.sysfs=/host/sys'
      - '--collector.filesystem.mount-points-exclude=^/(sys|proc|dev|host|etc)($$|/)'
    ports:
      - 9100:9100
    networks:
      - monitoring

  prometheus:
    image: prom/prometheus:latest
    container_name: prometheus
    restart: unless-stopped
    volumes:
      - ./prometheus:/etc/prometheus/
      - prometheus_data:/prometheus
    command:
      - '--config.file=/etc/prometheus/prometheus.yml'
      - '--storage.tsdb.path=/prometheus'
      - '--web.console.libraries=/etc/prometheus/console_libraries'
      - '--web.console.templates=/etc/prometheus/consoles'
      - '--web.enable-lifecycle'
    ports:
      - 9090:9090
    networks:
      - monitoring

  alertmanager:
    image: prom/alertmanager:latest
    restart: unless-stopped
    container_name: alertmgr
    ports:
      - "9093:9093"
    volumes:
      - "./alertmanager:/config"
      - alertmanager-data:/data
    command: --config.file=/config/alertmanager.yml --log.level=debug
    networks:
      - monitoring


  grafana:
    image: grafana/grafana:latest
    container_name: grafana
    user: '0'
    ports:
      - 3000:3000
    restart: unless-stopped
    volumes:
      - ./grafana/provisioning:/etc/grafana/provisioning
      - /grafana_data:/var/lib/grafana

    networks:
      - monitoring
Create an app password in your Google account. Follow the official guide by Google.
Now create alert manager configuration using below:
# alertmanager.yml

route:
  receiver: 'Mail Alert'
  # group_by: [ alertname ]
  repeat_interval: 30s
  group_wait: 15s
  group_interval: 15s

receivers:
  - name: 'Mail Alert'
    email_configs:
      - smarthost: 'smtp.gmail.com:587'
        auth_username: '<your email id here>'
        auth_password: "<your app password here>"
        from: '<your email id here>'
        to: '<receiver's email id here>'
        headers:
          subject: 'Prometheus Mail Alerts'
Now, will create rules based on which we’ll get alerts.
#alerts.yml

groups:
- name: Example
  rules:

    - alert: InstanceDown
      expr: up == 0
      for: 15s
      labels:
        severity: critical
      annotations:
        summary: "Instance [{{ $labels.instance }}] down"
        description: "[{{ $labels.instance }}] of job {{ $labels.job }} has been down for more than 15 seconds."

# - name: NodeMemUsgae
  # rules:
    - alert: HostMemoryIsUnderutilized
      expr: ({__name__="node_memory_MemAvailable_bytes", instance="node-exporter:9100", job="node"} > 80)
      for: 15s
      labels:
        severity: critical
      annotations:
        summary: Host Memory is underutilized (instance {{ $labels.instance }})
        description: "Node memory is < 20% for 1 week. Consider reducing memory space. (instance {{ $labels.instance }})\n  VALUE = {{ $value }}\n  LABELS = {{ $labels }}"
We need to modify Prometheus configuration to include alertmanager and the rules configuration. I have added a node which does not exist for this demo. This is for getting the InsatnceDown alert.
#prometheus.yml

global:
  scrape_interval: 30s

rule_files:
  - alert.yml

alerting:
  alertmanagers:
    - scheme: http
      static_configs:
        - targets: [ 'alertmanager:9093' ]

scrape_configs:
  - job_name: 'prometheus'
    scrape_interval: 1m
    static_configs:
      - targets: ['localhost:9090']

  - job_name: 'node'
    static_configs:
      - targets: ['node-exporter:9100']

  - job_name: 'dummy_node'
    static_configs:
      - targets: ['localhost:1234']
So the directory structure looks like this:
[root@labputer Monitor_with_Prometheus]# tree
.
├── alertmanager
│   └── alertmanager.yml
├── docker-compose.yml
├── grafana
│   └── provisioning
│       ├── dashboards
│       │   ├── dashboard.yml
│       │   └── node_exporter.json
│       └── datasources
│           └── datasource.yml
└── prometheus
    ├── alert.yml
    └── prometheus.yml

6 directories, 7 files
Now start the containers with “docker compose up -d”. We can verify alertmanager at htpp://ip:9093 and will also be able to view the alets in Prometheus. At the beginning everything seems to be fine. We don’t see any alerts being active. But a few seconds and we shall see alerts firing and we’ll get emails.
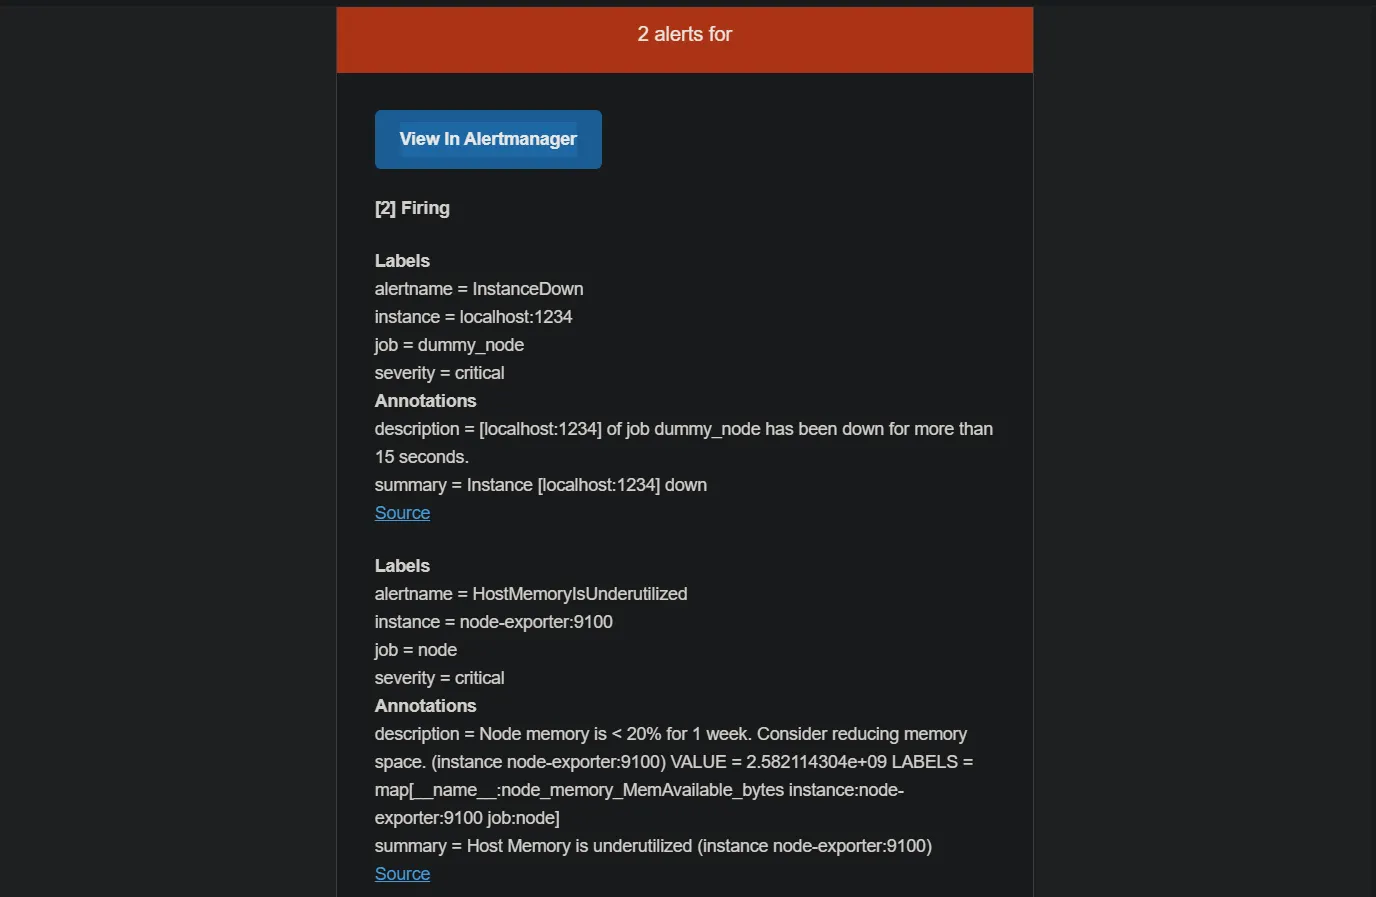
Here, both of the alerts were combined and sent via a single mail. If you want to receive separate mails based on the alert types, enable the group_by in alertmanager.yml.
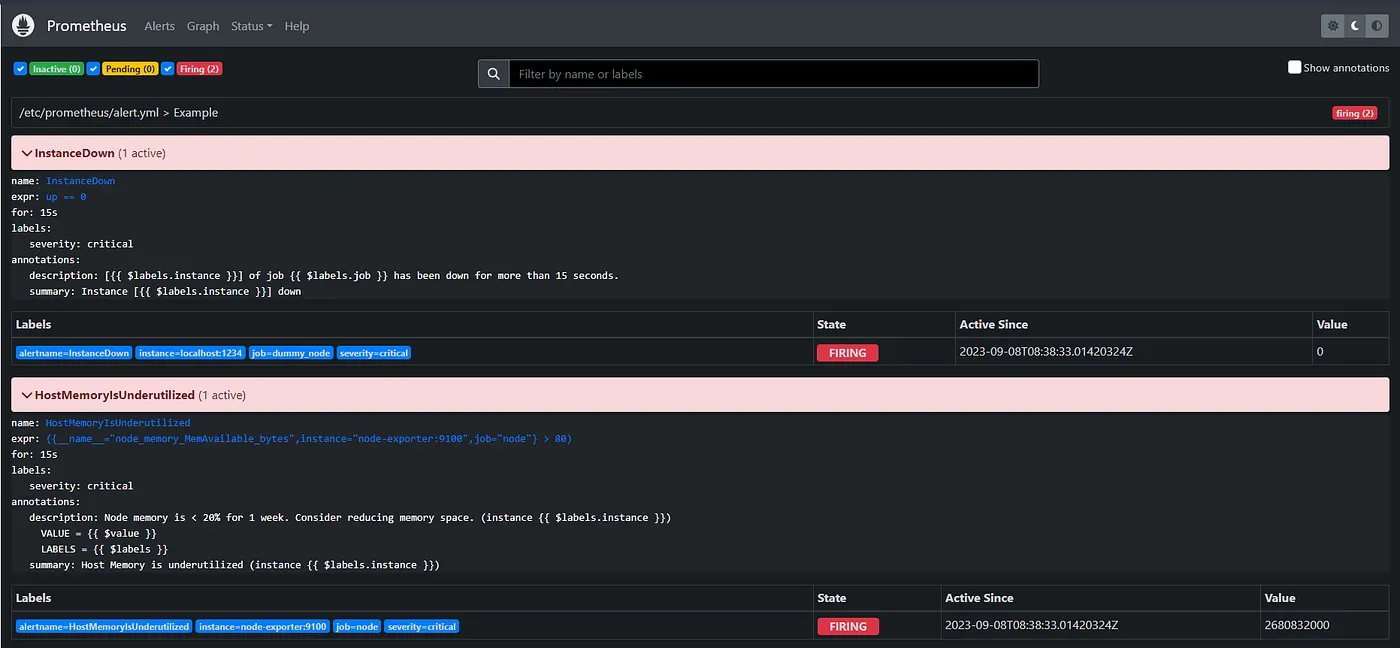
To view the alerts and Prometheus, click on the alert tab. Expand the alerts to view the rule. Check the annotations box to view the target where the rule is being applied.
The alerts and rules can also be viewed from alert manager. The status tab shows the status of alert manager as well as the rules we defined.
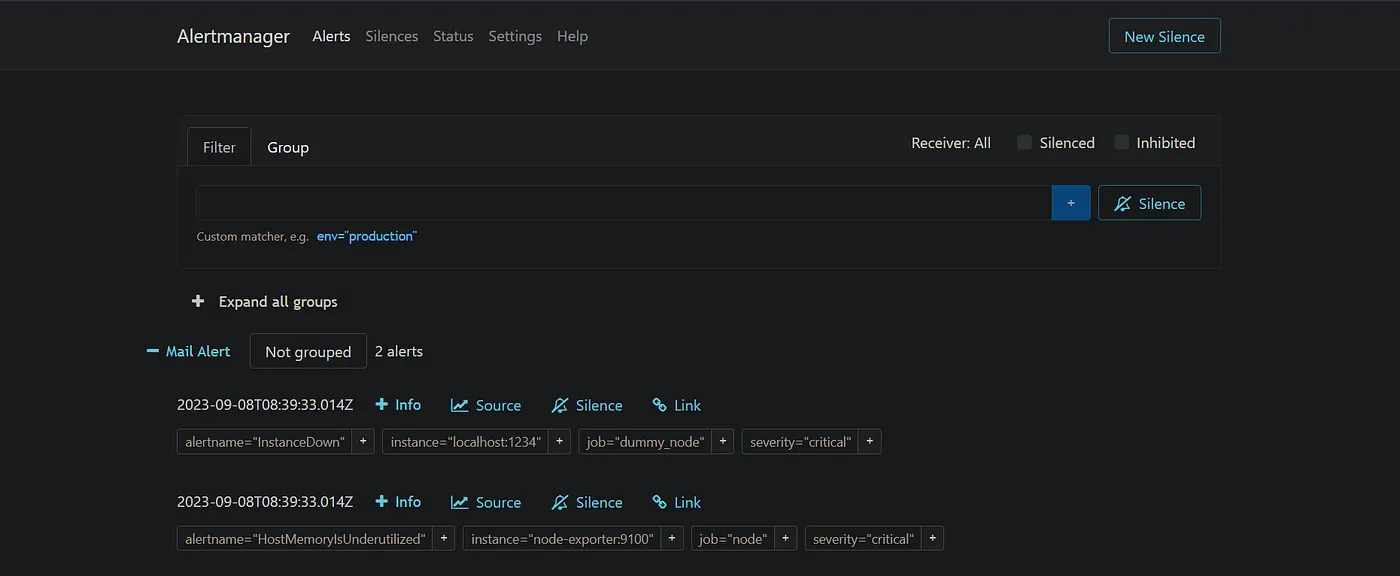
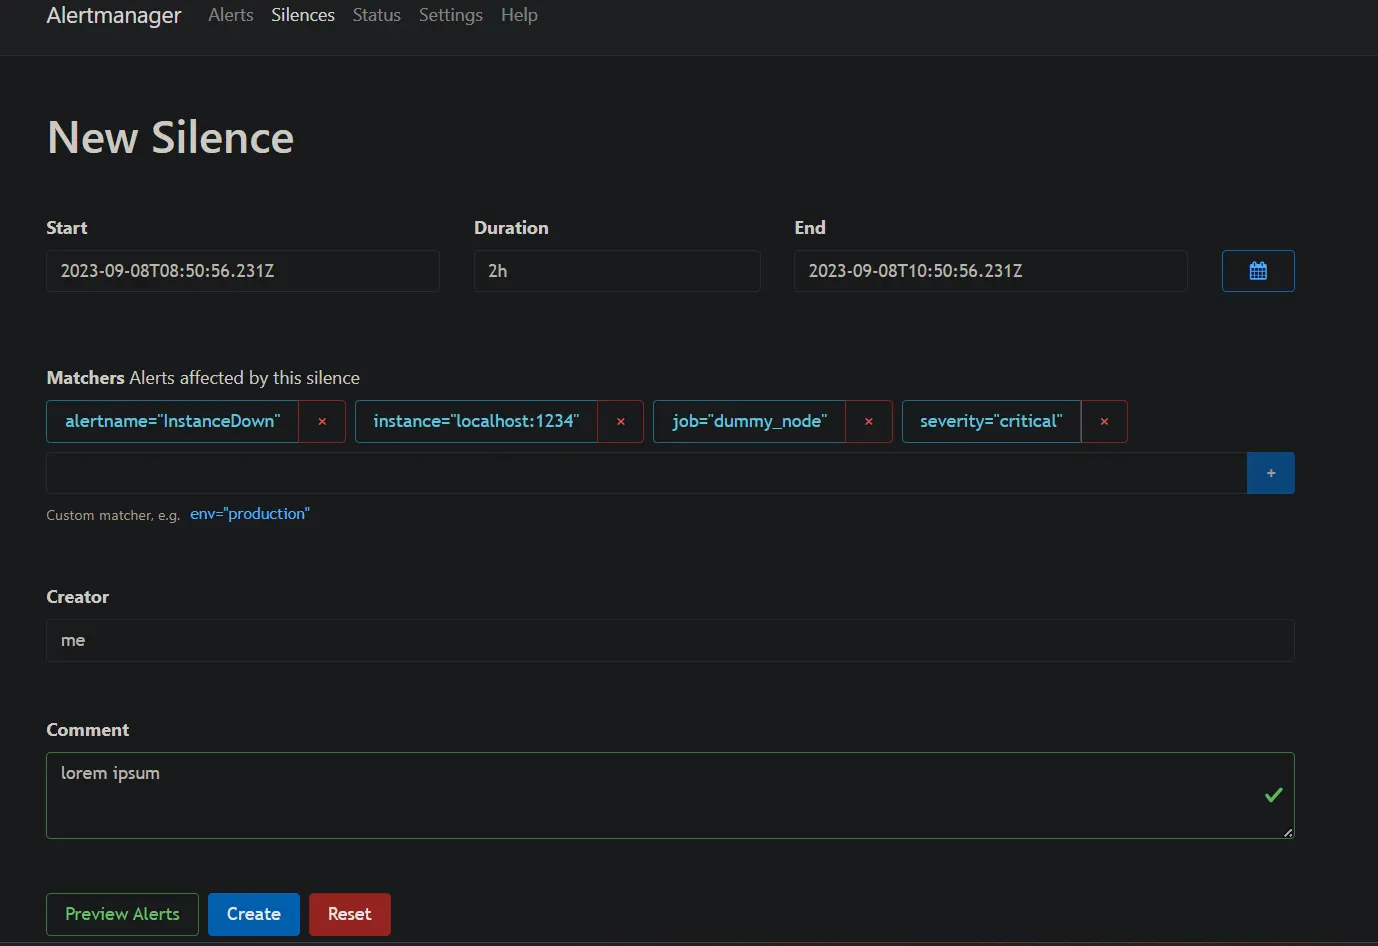
You can silence any alert for a particular period of time. Click on the silence button above the alert. A new window appears to choose duration and etc. Fill all mandatory fields and click create.
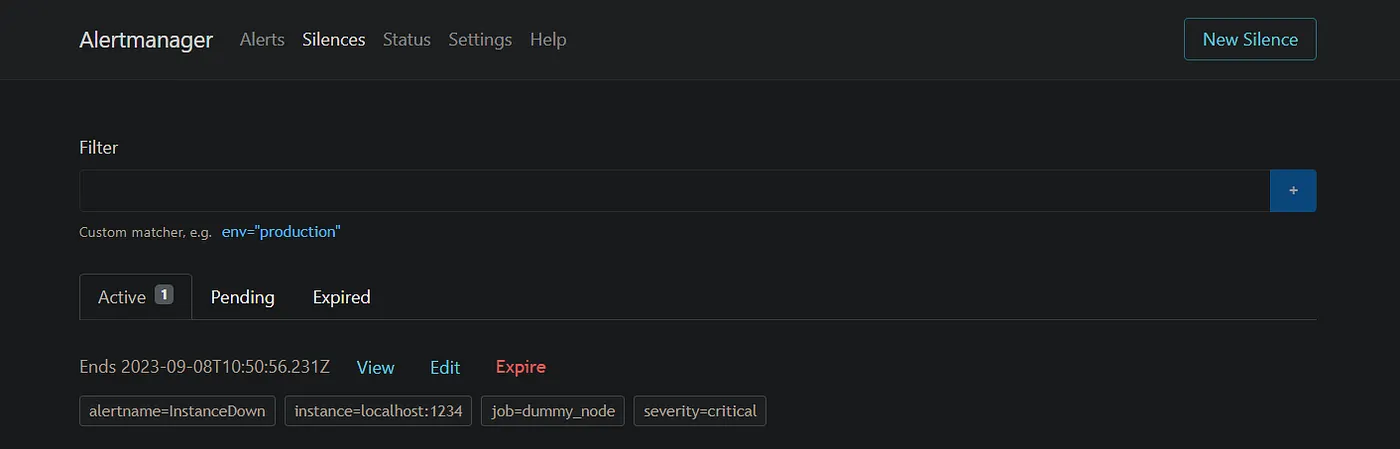
You can make a silenced alert expire the duration forcefully and receive the alerts again.
Hope you found this article helpful. In the next article we’ll discuss monitoring your website using Blackbox exporter.
Thanks for reading.
Reference: Prometheus.io